Tag Archives: ipcc

IPCC AR6

AR6 is the synthesis report for the sixth climate change assessment. We kind of know what we need to do, and what we are actually doing is too little and almost too late. That hasn’t changed from the last set of reports. I’ll try to up my graphics game a bit and discuss a couple of the IPCC’s fancy graphics.

Food and flooding. I’ve been thinking these might be the two elevator pitches to convince ordinary people that climate change is coming for all of us. Floods are coming for our houses whether we live in coastal areas impacted by sea level rise or inland areas impacted by intense storm. Everybody eats food. There are more mouths to feed all the time, heat depresses grain yields, and at the same time we are being flooded we have less water from snow, glaciers, and overpumped groundwater to irrigate our crops. Fire is also an issue.

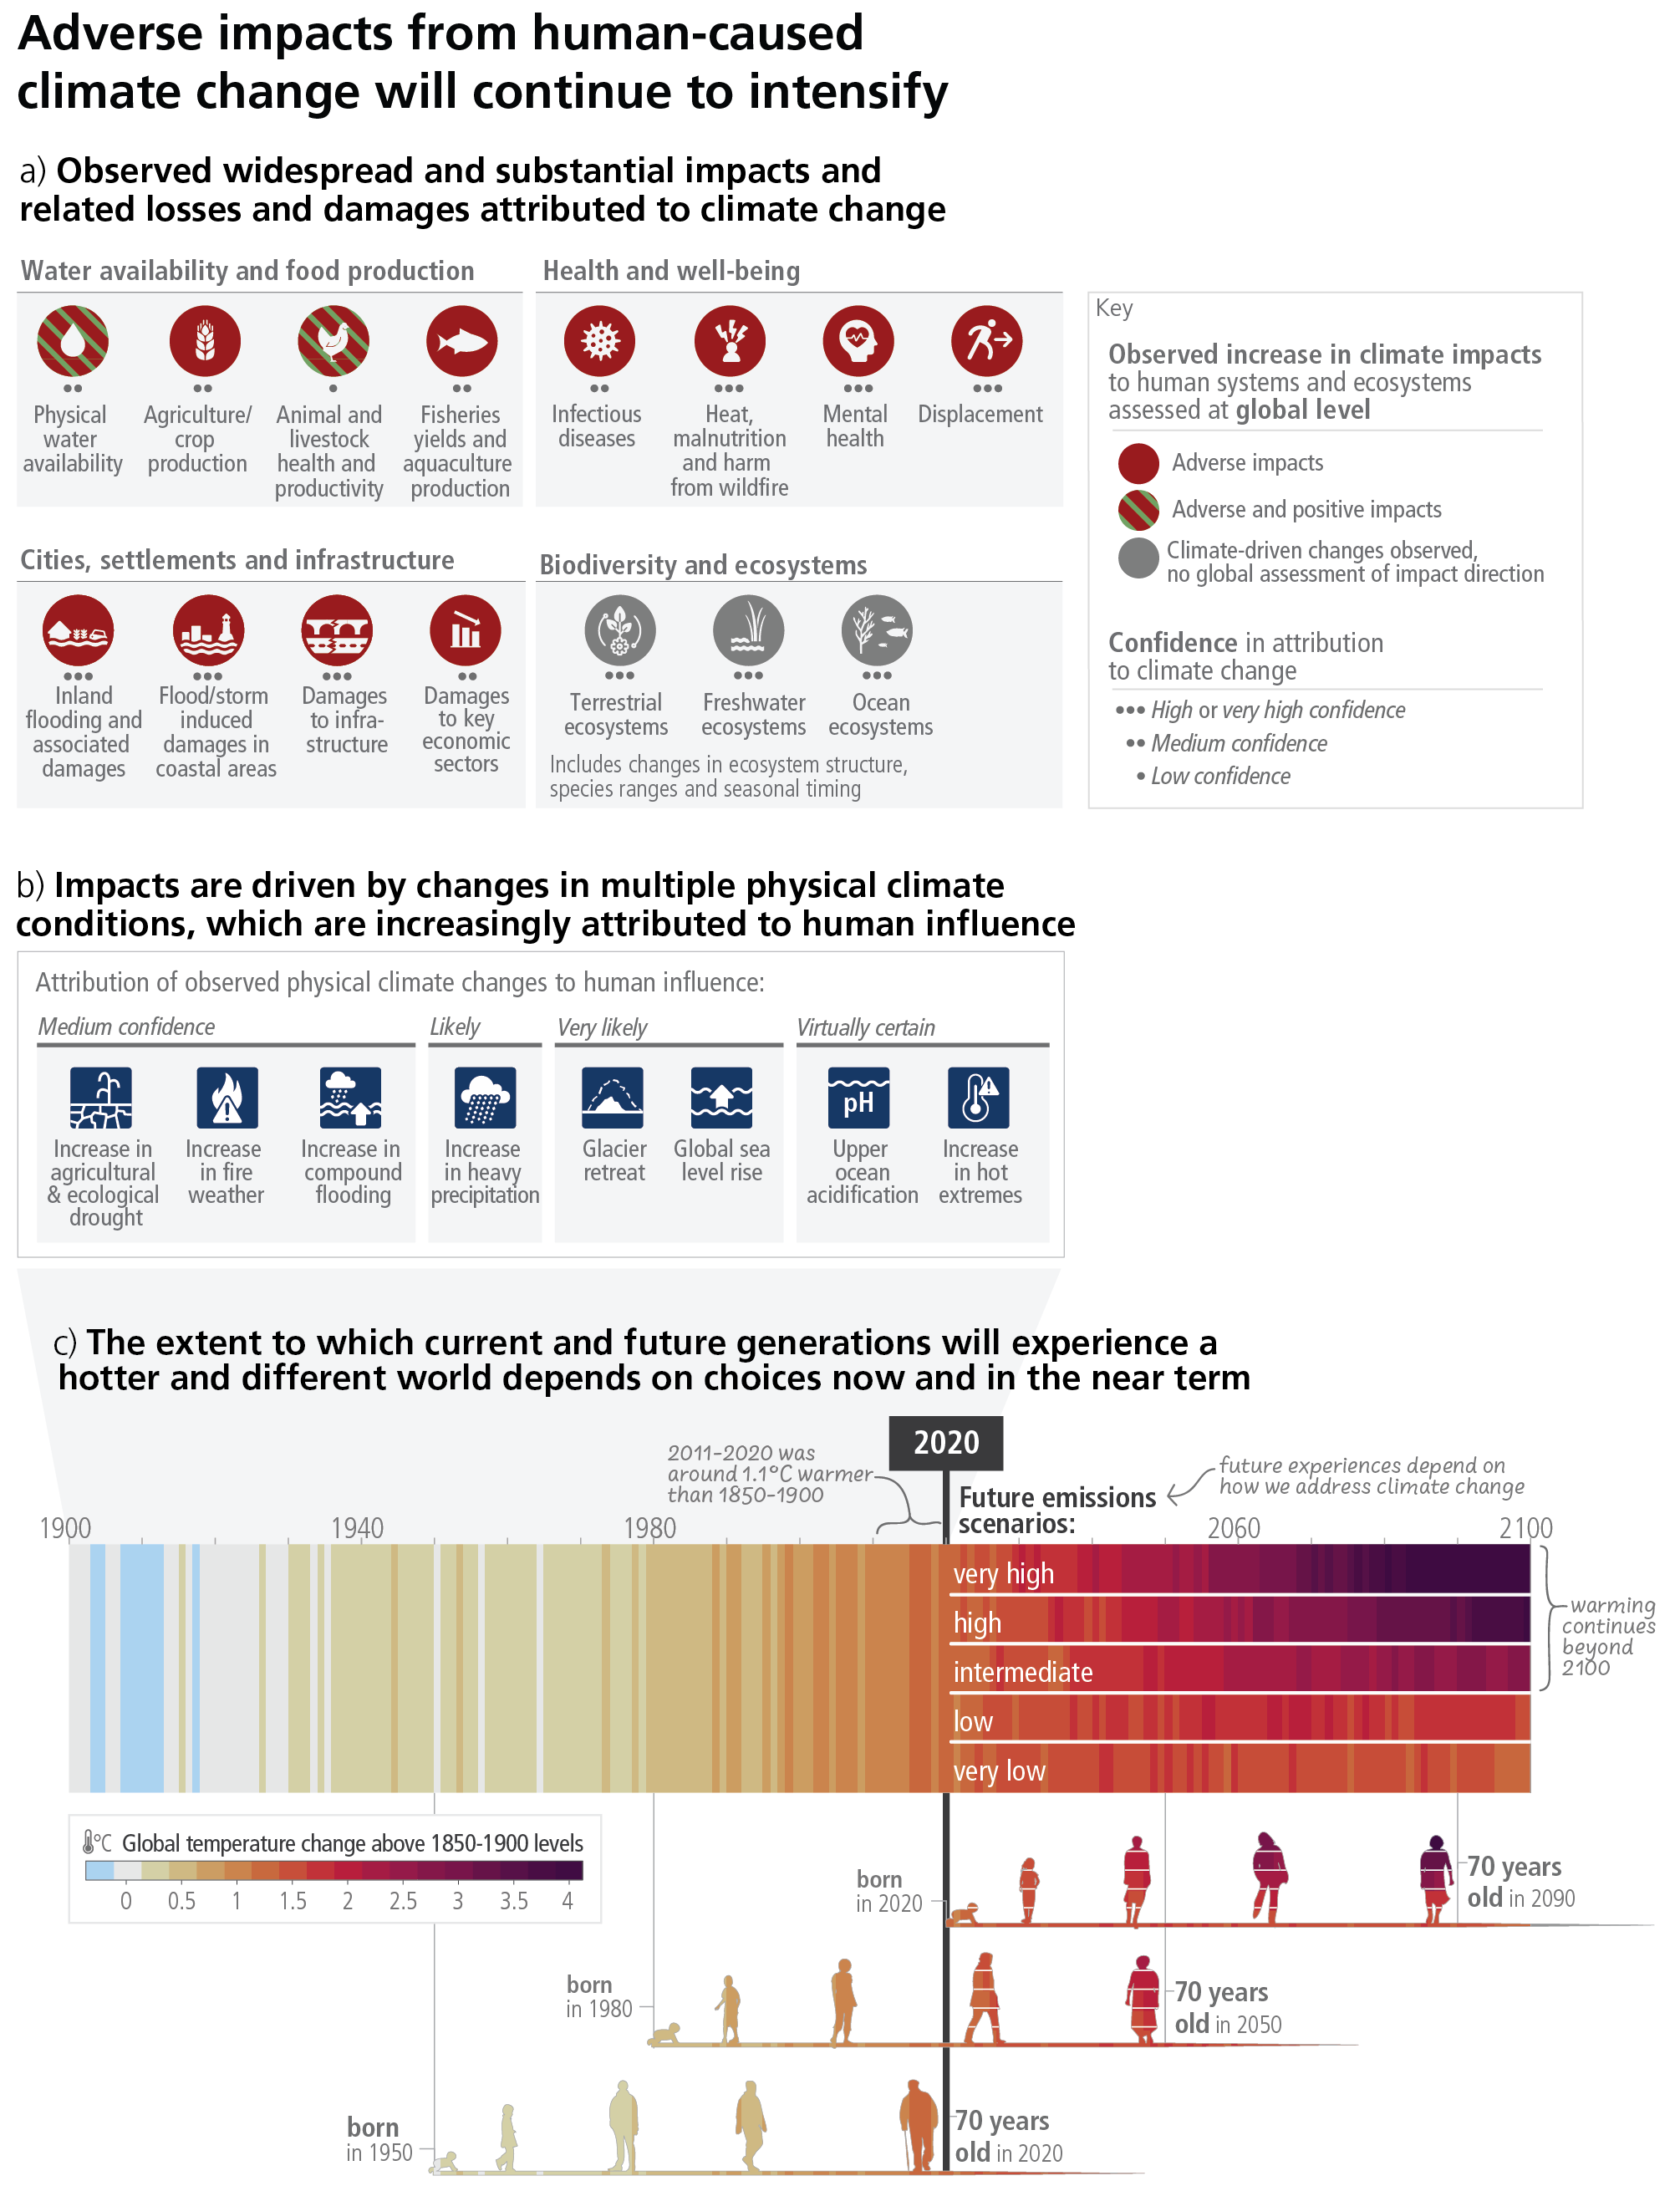
In this (overcomplicated?) graphic, IPCC says that scientists have medium confidence physical water scarcity is already affecting us, medium confidence that crop production is already affecting us, high confidence that inland and coastal flooding are already affecting us, and high confidence that displacement is already resulting. Biodiversity and ecosystems? Forget about it.

Figure SPM.1

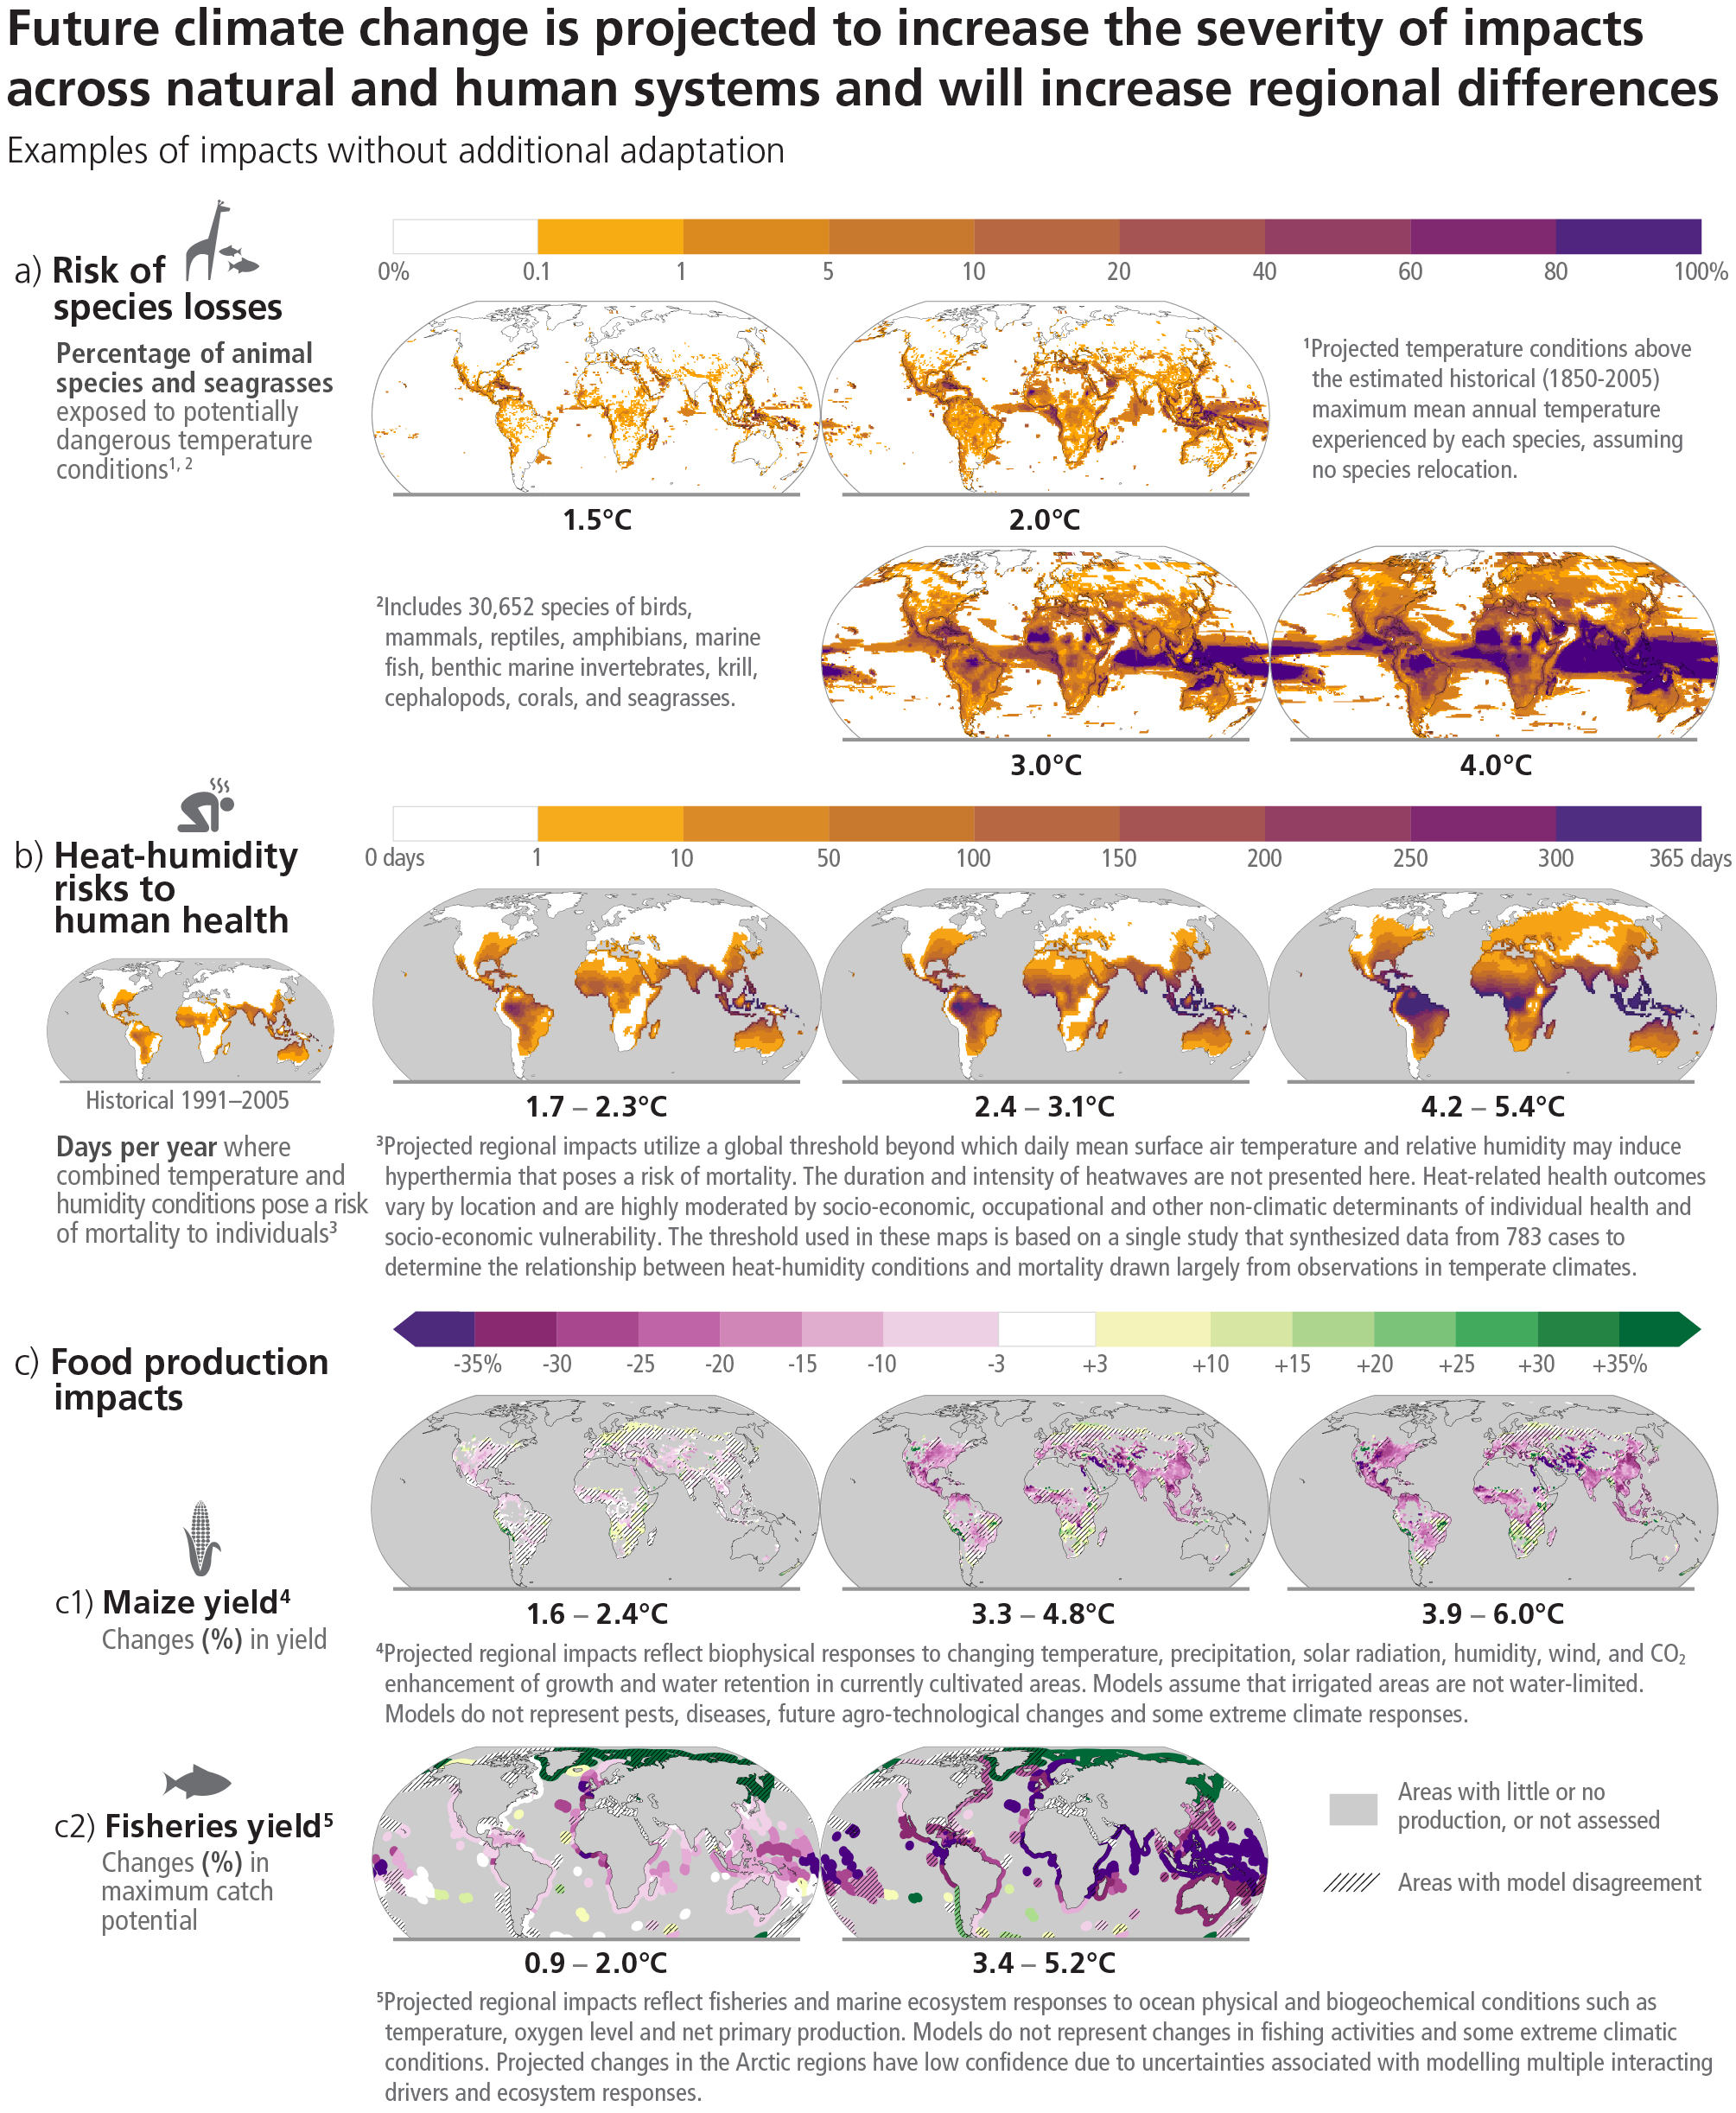
You have to quint or zoom in, but the overcomplicated infographic below gives you an idea where and how much heat is expected to depress grain yields. We might be able to grow more in parts of Russia, Africa, and South America, but if we get over 3 degrees C warming the impacts on North America, India and Southeast Asia are concerning.

Figure SPM.3

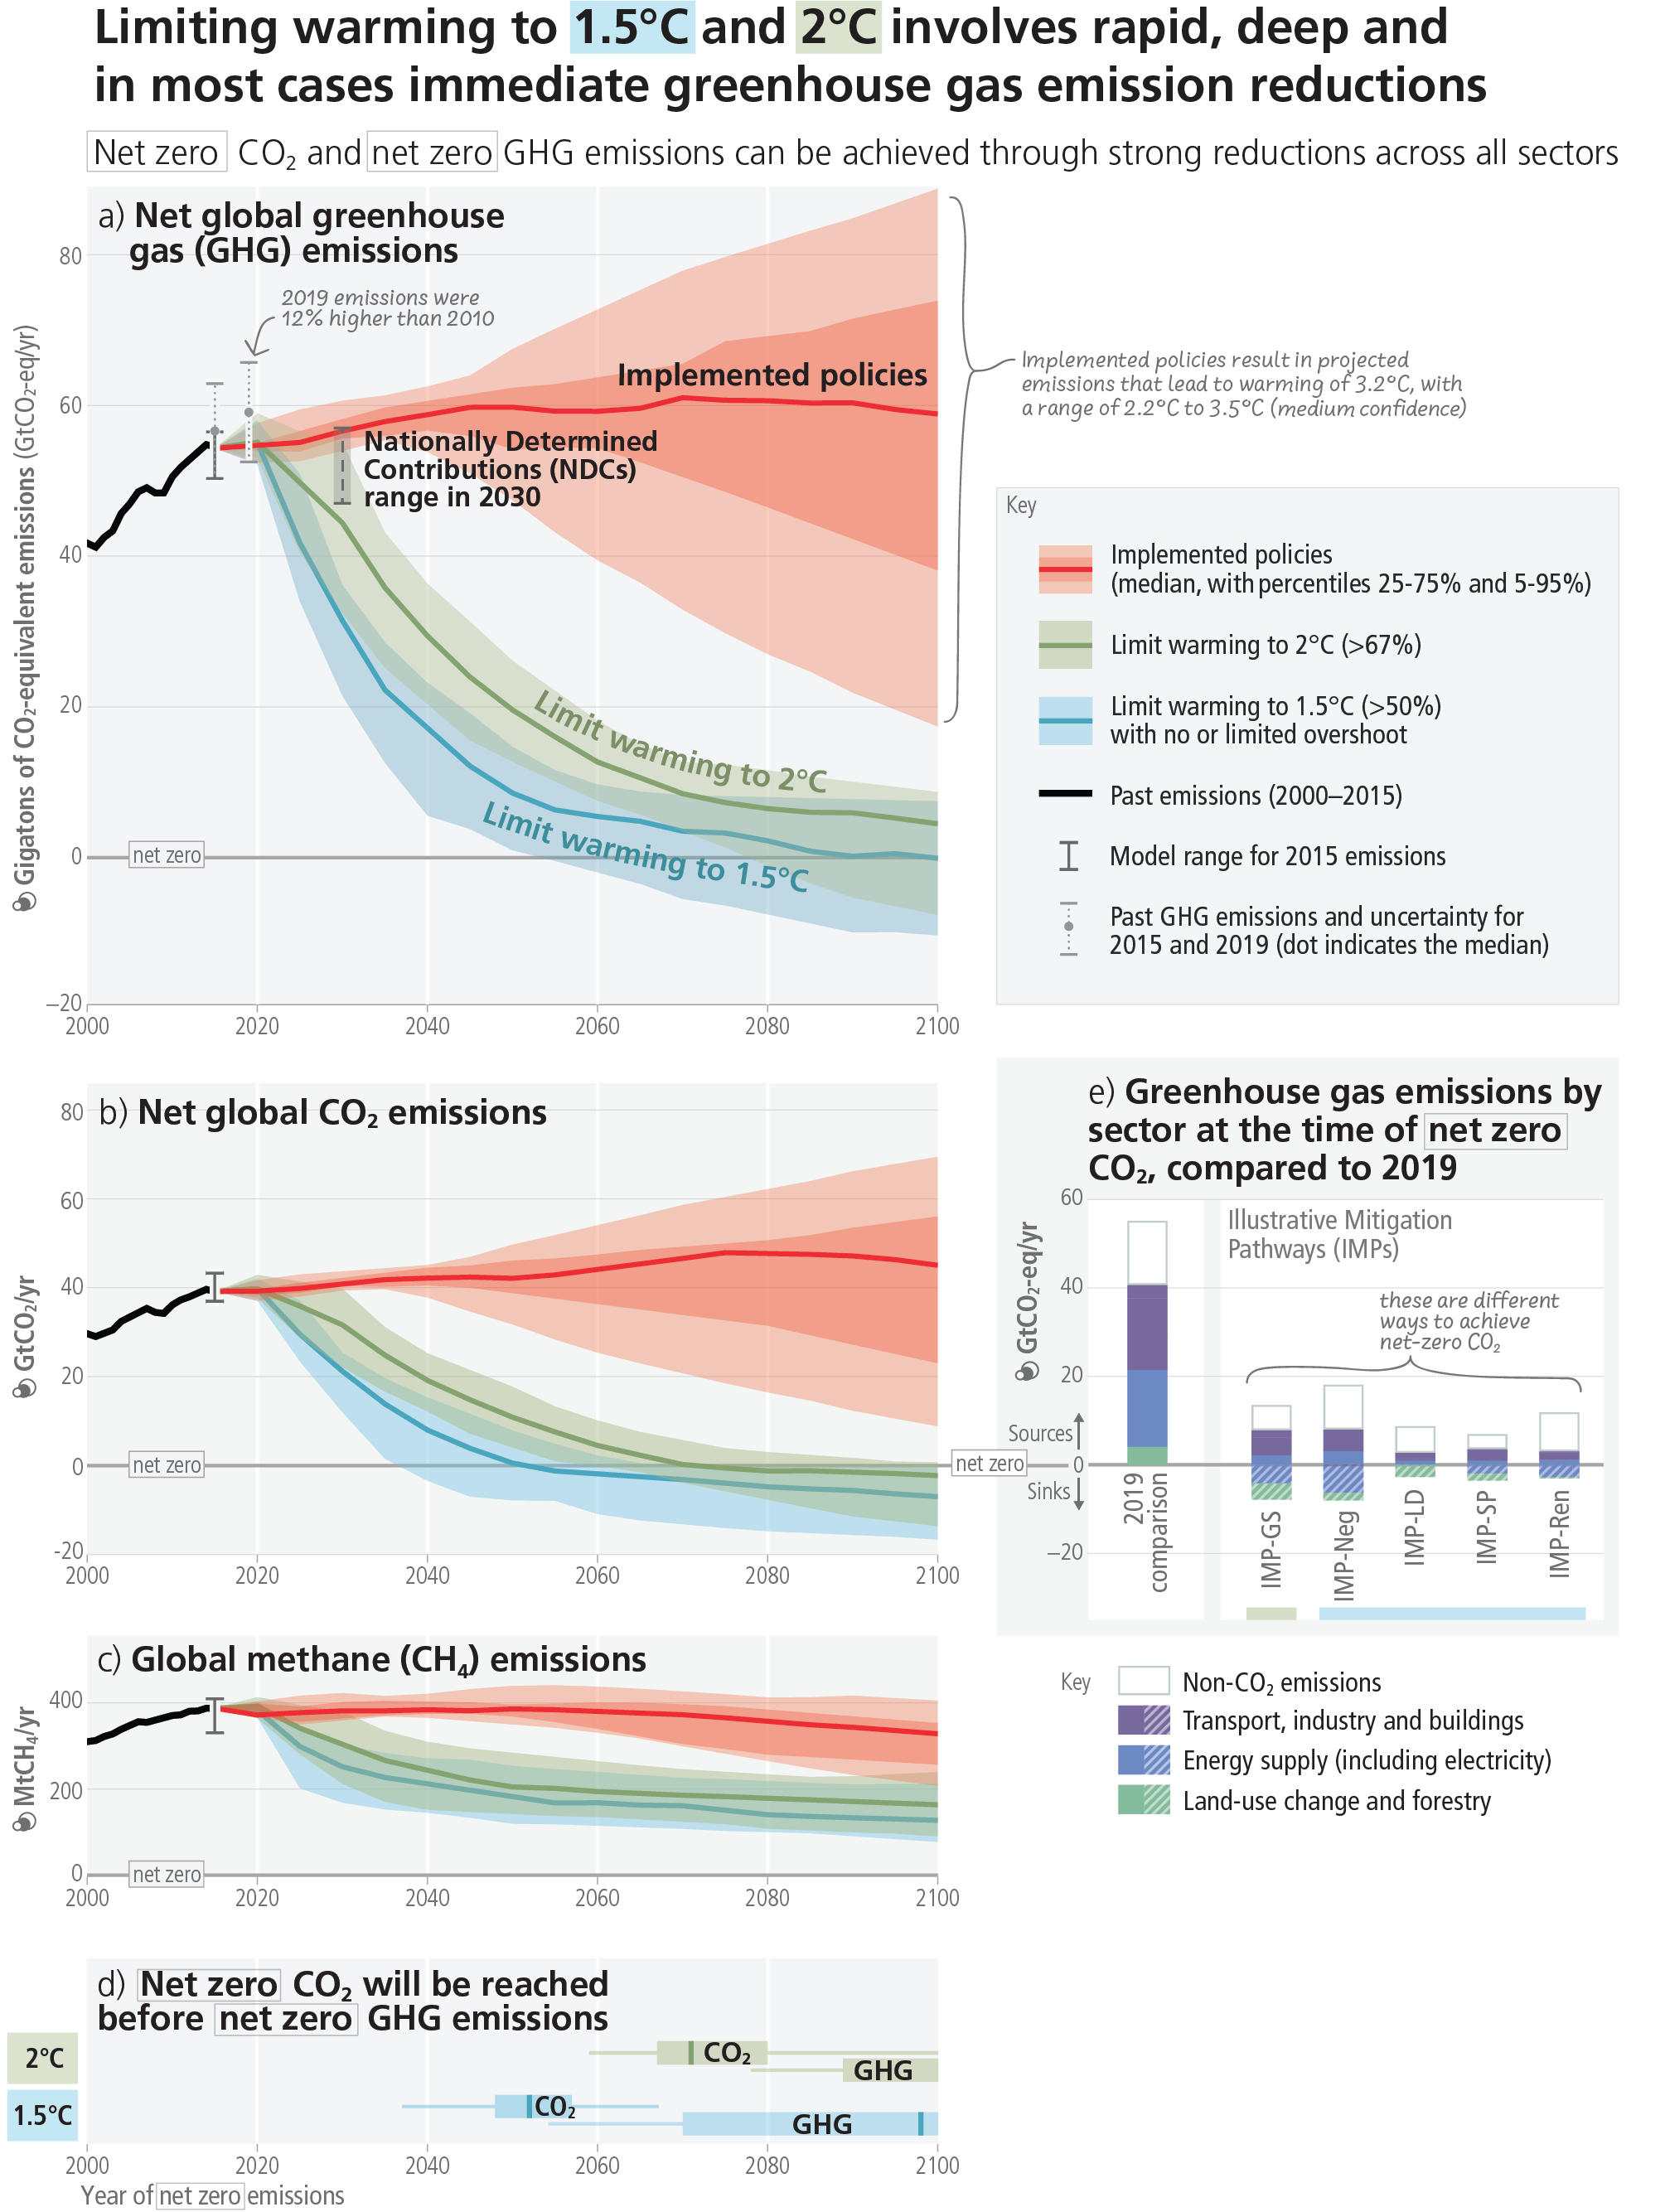
Finally, the time series graphs below make a very clear case that although emissions might have leveled off, the world is not on a trajectory to make the magnitude of emission cuts needed to limit warming to 2 degrees C or less.

Figure SPM.5

the new IPCC physical science basis for we’re fucked

I suppose I have to say something about the new IPCC science report that came out this week (I’m writing on Thursday, August 12). It’s easy to find summaries of it from actual journalists in the media, for example this one from the AP.

I’ve only read the summary for policy makers. I have the best intentions to read the full report, but then I had the best intentions to read the last 16 IPCC reports, not to mention the proliferating ecosystem and biodiversity reports. Anyway, if you don’t mind a collection of random observations, here are a handful of things that caught my eye:

  • The graphics are kind of nice. If you are trying to communicate science-y or tech-y things to general audiences, they are worth a glance.
  • If we stopped emitting carbon emissions today, the earth would continue to warm for decades, if not centuries or millennia. This means the effects we are feeling right now were caused by emissions decades ago. Emissions have not only continued for decades, but they have accelerated. Things are going to continue to get worse, and probably not linearly but exponentially. If we drastically cut emissions today, the results would be detectable in about 20 years or so. The Earth is a dynamic system with lags and feedback loops.
  • Warming of about 1.5 degrees C (I don’t know how to make a degree symbol in WordPress) would be considered a great outcome. The Earth has already warmed by about 1.0 degrees as of right now (2019 actually).
  • Human activity is the overwhelming cause of warming. Come on, don’t be stupid. Natural factors exist but they are small compared to the human activity.
  • One thing that did surprise me is that scientists are pretty sure that human-caused air pollution has had a significant retarding (using this word in the scientific/musical sense of slowing something down) effect on global warming. But again, more than overwhelmed by the sheer magnitude of burning, burning, burning with reckless abandon for centuries now.
  • Scientists are very sure human activity is driving massive ice loss in the Arctic. They are only kind of medium sure it is the main driver in the Antarctic.
  • So what is a good place to live? Well, central and eastern North America are some of the only regions are Earth that are not unequivocally hotter already, meaning scientists disagree on whether they are or not. They are more at risk of flooding though, along with most of Asia. Drought is biting harder in western North America, parts of Europe, Central Asia, Africa, and southern Australia than elsewhere.
  • There are five scenarios in this report. They are called SSP1-1.9, SSP1-2.6, SSP2-4.5, SSP3-7.0 and SSP5-8.5.

Compared to 1850–1900, global surface temperature averaged over 2081–2100 is very likely to be higher by 1.0°C to 1.8°C under the very low GHG emissions scenario considered (SSP1-1.9), by 2.1°C to 3.5°C in the intermediate scenario (SSP2-4.5) and by 3.3°C to 5.7°C under the very high GHG emissions scenario (SSP5-8.5)24. The last time global surface temperature was sustained at or above 2.5°C higher than 1850–1900 was over 3 million years ago (medium confidence).

IPCC
  • Coastal property may not be a good investment.
  • Scientists are divided on the tipping point theories involving the global meridional circulation. They agree it is going to weaken though. The tipping point collapse scenarios “can’t be ruled out and are part of risk assessment”. Ha – risk assessment language might say something like “unknown but non-zero probability, existential threat”.
  • The report provides a remaining carbon budget that could be used for policy making, depending on the end point the world would like to target.

IPCC terminology

I find some of the IPCC terminology interesting. Alternatives analysis and communication of uncertainty are professional interests of mine. I am afraid I am not all that good at them, but when I see the state of the art in scientific communication from the experts sometimes I feel a little better.

Here is a footnote in the Summary for Policy Makers on the terminology they use to try to communicate uncertainty.

A level of confidence is expressed using five qualifiers: very low, low, medium, high and very high, and typeset in italics, for example, medium confidence. The following terms have been used to indicate the assessed likelihood of an outcome or a result: virtually certain 99–100% probability, very likely 90–100%, likely 66 100%, about as likely as not 33–66%, unlikely 0–33%, very unlikely 0–10%, exceptionally unlikely 0–1%. Additional terms (extremely likely 95–100%, more likely than not >50–100%, more unlikely than likely 0–<50%, extremely unlikely 0–5%) may also be used when appropriate. Assessed likelihood is typeset in italics, for example, very likely.

Here are some definitions of scenarios and pathways in Chapter 1 of Global Warming of 1.5 °C.

A ‘scenario’ is an internally consistent, plausible, and integrated description of a possible future of the human–environment system, including a narrative with qualitative trends and quantitative projections (IPCC, 2000). Climate change scenarios provide a framework for developing and integrating emissions, climate change and climate impact projections, including an assessment of their inherent uncertainties. The long-term and multi–faceted nature of climate change requires climate scenarios to describe how assumptions about inherently uncertain socio-economic trends in the 21st century could influence future energy and land use, resulting in emissions, and climate change as well as human vulnerability and exposure to climate change. Such driving forces include population, GDP, technological innovation, governance, and lifestyles. Climate change scenarios are used for analysing and contrasting climate policy choices.

The notion of a ‘pathway’ can have multiple meanings in the climate literature. It is often used to describe the temporal evolution of a set of scenario features, such as GHG emissions and socioeconomic development. As such, it can describe individual scenario components or sometimes be used interchangeably with the word ‘scenario’. For example, the RCPs describe GHG concentration trajectories (van Vuuren et al., 2011) and the SSPs are a set of narratives of societal futures augmented by quantitative projections of socio-economic determinants such as population, GDP, and urbanization (Kriegler et al., 2012; O’Neill et al., 2014). Socio-economic driving forces consistent with any of the SSPs can be combined with a set of climate policy assumptions (Kriegler et al., 2014) that together would lead to emissions and concentration outcomes consistent with the RCPs (Riahi et al., 2017). This is at the core of the scenario framework for climate change research that aims to facilitate creating scenarios integrating emissions and development pathways dimensions (Ebi et al., 2014; van Vuuren et al., 2014).

the new IPCC report

Here’s the new IPCC report, Global Warming of 1.5 °C. I guess the idea is to show that this amount of warming, which most nations of the world have tentatively agreed to target, is still pretty bad. And the world is not even remotely on the path toward limiting warming to this level.

The report estimates the world has already warmed by about 1.0 degree C on average due to emissions that have already happened. If we stopped emissions today, the world would continue to warm, but warming would peak somewhere between 1.0 and 1.5 degrees C. I think this is an important concept to grasp – the effects that are beginning to be felt now are not the result of emissions happening now, but of past emissions including emissions decades ago. They would continue and get worse even if we stopped emitting today, and not only are we not lowering emissions, we are continuing and even accelerating them. So the problem is potentially one of runaway, exponentially growing consequences and we are only at the very beginning of the curve.

I find the report difficult to distill into key messages. Here are a couple paragraphs on impacts (starting on p. 1-29 if you are following along at home):

 Impacts of climate change are due to multiple environmental drivers besides rising temperatures, such as rising atmospheric CO2, shifting rainfall patterns, rising sea levels, increasing ocean acidification, and extreme events, such as floods, droughts, and heat waves (IPCC, 2014e). For example, changes in rainfall affect the hydrological cycle and water availability (Schewe et al., 2014). Several impacts depend on atmospheric composition, for example, increasing atmospheric carbon dioxide levels leading to changes in plant productivity (Forkel et al., 2016), but also to ocean acidification (Hoegh Guldberg et al., 2007). Other impacts are driven by changes in ocean heat content, for example, the destabilization of coastal ice-sheets and sea-level rise (Bindoff et al., 2007; Chen et al., 2017), whereas impacts due to heat waves depend directly on ambient air or ocean temperature (Matthews et al., 2017). Impacts can be direct, for example, coral bleaching due to ocean warming, and indirect, for example, reduced tourism due to coral bleaching. Indirect impacts can also arise from mitigation efforts such as changed agricultural management (Section 3.6.2) or remedial measures such as solar radiation modification (Section 4.3.8, Cross-Chapter Box 10 in Chapter 4).

Impacts may also be triggered by combinations of factors, including ‘impact cascades’ (Cramer et al., 2014) through secondary consequences of changed systems. Changes in agricultural water availability caused by upstream changes in glacier volume are a typical example. Recent studies also identify compound events (e.g., droughts and heat waves), that is, when impacts are induced by the combination of several climate events (AghaKouchak et al., 2014; Leonard et al., 2014; Martius et al., 2016; Zscheischler and Seneviratne, 2017).

The rest of the report goes into various scenarios and pathways for achieving the 1.5 degrees C limit.

The Summary for Policy Makers has some attempts to convey these concepts in a more graphical way.

the “new Pliocene”

New evidence from fossil cores supports the idea that more greenhouse gases means warmer temperatures in a more or less linear way.

During the Pliocene, the Earth’s temperature was often several degrees higher than in pre-industrial times, while atmospheric CO2 levels were around 350-450 parts per million (ppm), similar to the levels reached in the past few years (400 ppm).

By studying the relationship between CO2 levels and climate change during a warm period in the Earth’s history, the scientists have been able to estimate how the climate will respond to increasing levels of CO2, a parameter known as climate sensitivity.

The findings suggest that climate sensitivity was similar in a warmer world to other times – allaying concerns that warming could produce positive feedbacks that would accelerate warming above that expected from modelling studies.

I wouldn’t call this great news, but it does suggest we will have a chance to adjust to gradual change, rather than being blind-sided by some sudden catastrophic change.

IPCC AR5

IPCC’s 5th Assessment Report is out. It’s a long, exhausting document that I will probably slog my way through little by little. I’ve pulled out just a couple passages here about food production and fisheries, which are two risks I tend to think about. I think humans can generally deal with higher temperatures and more frequent storms and coastal flooding, because there is such a wide range of these things now and we deal with them. Food production is the intersection of water, energy, and ecosystems.

Assessment of many studies covering a wide range of regions and crops shows that negative impacts of climate change on crop yields have been more common than positive impacts (high confidence). The smaller number of studies showing positive impacts relate mainly to high-latitude regions, though it is not yet clear whether the balance of impacts has been negative or positive in these regions (high confidence). Climate change has negatively affected wheat and maize yields for many regions and in the global aggregate (medium confidence). Effects on rice and soybean yield have been smaller in major production regions and globally, with a median change of zero across all available data, which are fewer for soy compared to the other crops. (See Figure 1.11C) Observed impacts relate mainly to production aspects of food security rather than access or other components of food security. Since AR4, several periods of rapid food and cereal price increases following climate extremes in key producing regions indicate a sensitivity of current markets to climate extremes among other factors (medium confidence)…

Global marine species redistribution and marine biodiversity reduction in sensitive regions, under climate change, will challenge the sustained provision of fisheries productivity and other ecosystem services, especially at low latitudes (high confidence). By the mid-21st century, under 2 °C global warming relative to pre-industrial temperatures, shifts in the geographical range of marine species will cause species richness and fisheries catch potential to increase, on average, at mid and high latitudes (high confidence) and to decrease at tropical latitudes and in semi-enclosed seas (Figure 2.6A) (medium confidence). The progressive expansion of Oxygen Minimum Zones and anoxic ‘dead zones’ in the oceans will further constrain fish habitats (medium confidence). Open-ocean net primary production is projected to redistribute and to decrease globally, by 2100, under all RCP scenarios (medium confidence). Climate change adds to the threats of over-fishing and other non-climatic stressors (high confidence).

We talk so much about the atmosphere, but our oceans, forests, and soils are absorbing a lot of the carbon emissions, and are the reason our planet and current civilization are as resilient as they are. We better take care of them.